
Group analysis
The Groups tab compares the saved results of one assay across groups, such as WT vs KO or vehicle vs drug. It works on all results of that assay, whether they came from video, manual entry or import. The chips at the top (Assay · Analysis · Groups · Figure · Statistics) jump to each card.
If there are no results yet, the tab offers Go to Experiment and Import Data.
1. Assay
Choose the assay. Only assays with saved results are listed. For assays with several phases, the phase usually analyzed is preselected: Test for object recognition and place preference, Acquisition for the water and Barnes mazes, Cue test for fear conditioning. Different phases are not pooled unless you ask for it.
2. Analysis
Design
The design decides what one data point is and which test is used.
| Design | One value per … | Typical question | Available when |
|---|---|---|---|
| Compare groups | animal (its sessions averaged) | Do KO mice travel less than WT? | always |
| Across days | animal and day (trials of a day averaged) | Do the groups learn the water maze at different rates? | results have ≥ 2 different days |
| Time course | animal and series point (time bin, CS, trial) | Does freezing differ across the three CS presentations? | results carry a series |
| Paired measures | animal, two measures | Do the mice explore the novel object more than the familiar one? | assays with a natural pair |
| Change between phases | animal, difference To − From | Did conditioning shift place preference (test − pre-test)? | results have ≥ 2 phases |
The pairs offered under Paired measures are novel vs familiar (NOR), paired vs unpaired side (CPP), sucrose vs water intake (SPT), target vs opposite quadrant (water and Barnes mazes), baseline vs CS freezing (fear), and open vs closed arm time (EPM).
Measure and filters
- Measure, Series or Comparison: what to analyze, depending on the design.
- From → To: the two phases for Change between phases.
- Phase (or Beam, Session / block): restricts the analysis to one phase. All pools them, and the app notes when animals had several sessions that were averaged.
- Statistics: Parametric or Non-parametric.
- Comparisons, with three or more groups: All pairs, or Vs. first group when the first group is the control and only comparisons against it matter.
- Test each group against … appears for measures with a chance level: DI against 0; recognition index, sucrose preference, CPP preference and high-value choices against 50 %; quadrant time against 25 %.
- Include excluded records: shows results marked Exclude from group analysis again.
3. Groups
Groups are taken from the Group field of each result, and the spelling must match. In the card:
- the first group is treated as the control, and ▲ ▼ change the order, which is also the order in the figure;
- the switch includes or leaves out a group;
- tapping the color dot cycles its color. Colors come from a colorblind-safe palette (Okabe–Ito), and the control is gray by default. Order, colors and inclusion are remembered per assay.
4. Figure
Every figure shows each animal as a point, so the reader sees the spread and the n directly.
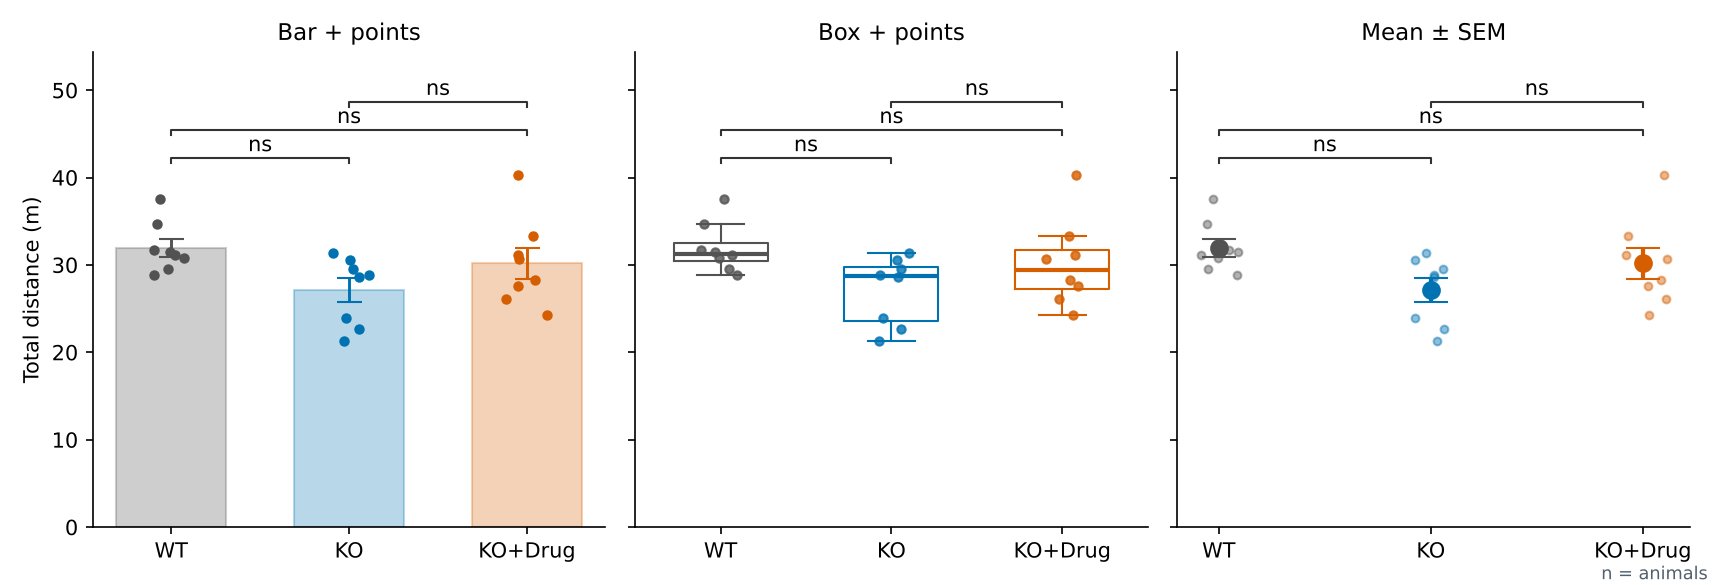
- Style: Bar + points, Box + points or Mean ± SEM, for Compare groups and Change between phases.
- Across days and Time course draw a learning curve or time course: group mean ± SEM at each level, with thin lines for individual animals.
- Paired measures draws one line per animal joining its two values.
- Significance brackets use the adjusted p values: * p < 0.05, ** p < 0.01, *** p < 0.001, **** p < 0.0001. Show non-significant comparisons (ns) adds brackets for the rest.
Export Figure (PNG) saves a high-resolution image (three times screen resolution) for slides or a manuscript draft.
5. Statistics
The statistics card states:
- the method in words, e.g. One-way ANOVA followed by Tukey–Kramer HSD for all pairwise comparisons. It can be copied into a methods section;
- the omnibus test with its statistic, degrees of freedom, p value and effect size;
- pairwise comparisons with adjusted p values;
- per-group tests against chance or within pairs, when requested;
- descriptive statistics (n = animals): n, mean ± SEM, SD, median and quartiles;
- notes, such as animals averaged over several sessions, excluded records left out, records with quality flags still included, or animals missing a day and left out of the ANOVA.
Statistics explains how the test is chosen and how each one is computed.
Exporting
The export menu at the top right offers:
| Item | Contents |
|---|---|
| Figure (PNG) | The current figure |
| Statistics (JSON) | The request, per-animal values, descriptive statistics and every test result |
| All … records (JSON) | Every result of this assay, ready to import on another iPhone or to read in R or Python |
| Copy text summary | A plain-text summary of method, tests and descriptive statistics, for a lab notebook or a message |
Import adds a table or JSON file directly from this tab.
Good practice
- n is the number of animals. Trials and sessions of one animal are averaged before testing. Do not enter the same animal under two IDs.
- Decide exclusions before looking at the statistics, for example tracking below 90 % or a minimum exploration time. Mark them with a reason instead of deleting results.
- Keep phases apart. Compare a probe trial with probe trials and a test with tests. Use Change between phases when the question is the change itself.
- Parametric or not? With small groups (n < 8) and clearly skewed or bounded data, such as latencies capped at the trial maximum or percentages near 0 or 100, the non-parametric tests are the safer choice. Choose before seeing the p values.