Quick start
This walkthrough scores one open-field video and then compares groups. It takes about five minutes plus the time the full analysis needs. Every later assay works the same way; only the arena and the settings differ.
Before you record
Tracking quality is decided when the video is recorded. If you have not filmed yet, read Recording videos that track well first: camera straight above, arena filling the frame, even light and good contrast between the animal and the floor.
1. Choose the assay and the video
- Open RodentFlow. You are on the Experiment tab.
- In the New experiment card, tap the assay row and pick Open Field / Center.
- Tap Analyze Video from Photos, or Choose Video from Files if the video is in the Files app, on iCloud Drive or on a USB drive.
The app reads the video information and opens the Setup screen. The step bar at the top reads Start → Set up → Preview → Result. Tap any step that is already reachable to go back or forward.
2. Fill in the setup
The setup screen is one scrolling page. The section menu at the top jumps to each card.
| Card | What to enter for this example |
|---|---|
| Experiment | Mouse ID (e.g. WT01), Group (e.g. WT), Sex. The experiment date is taken from the video when available. |
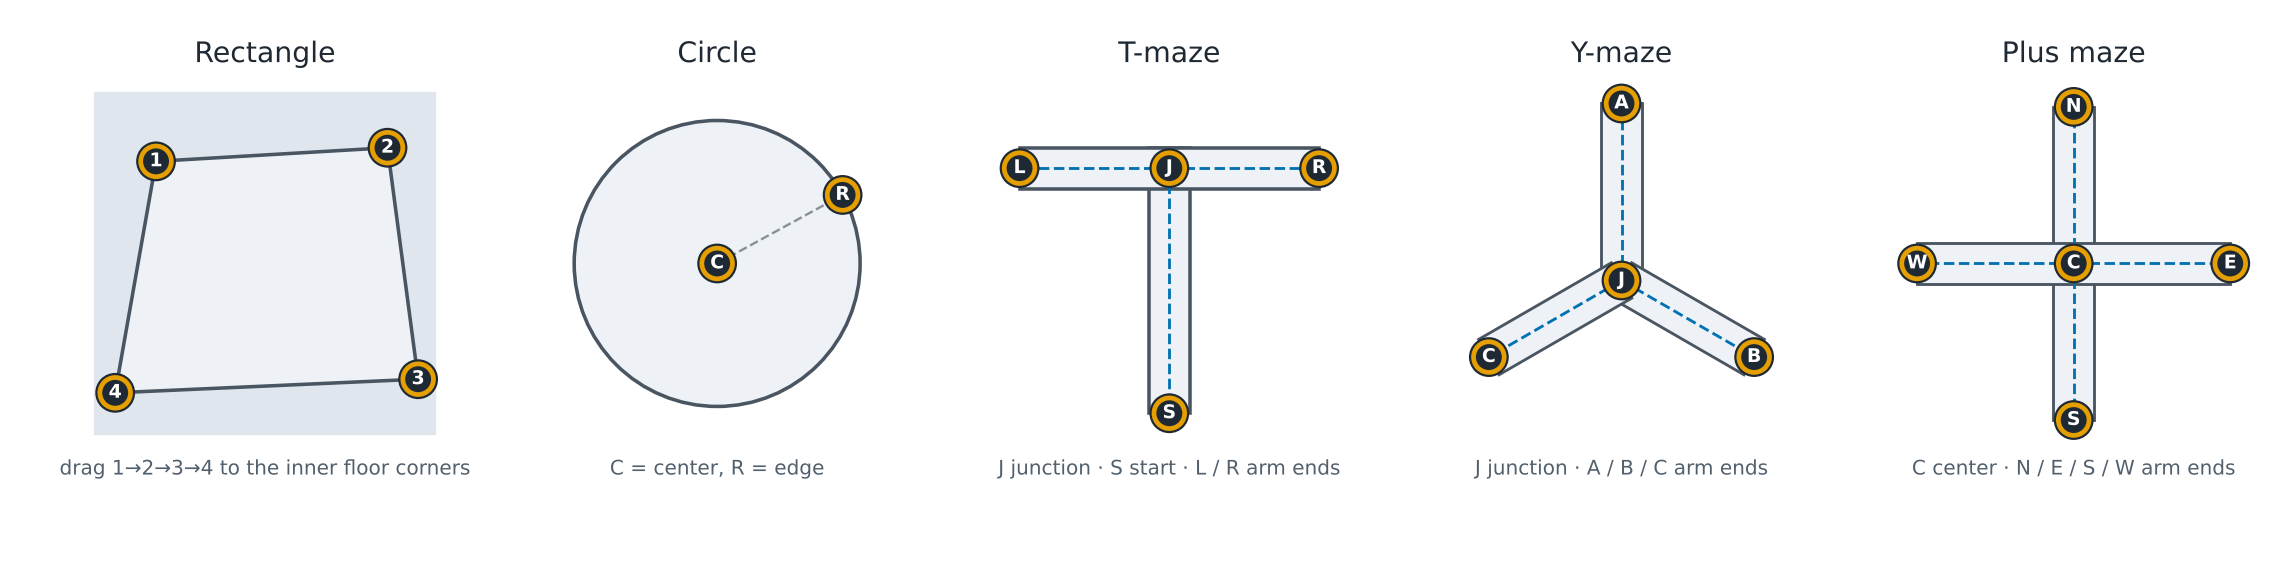
| Assay & arena | Arena shape Rectangle; Width and Height of the inner floor in cm, e.g. 40 × 40. |
| Analysis settings | Leave the defaults. The center zone is 50 % of the side. Everything here can be changed later. |
| 10-second preview | Leave the start where it is, or move it to a stretch where the animal is moving. |
| Calibration | Drag handles 1 → 2 → 3 → 4 onto the four inner corners of the floor, going around the arena. |
Tap Generate Preview › in the bottom bar.
3. Check the preview
The app tracks 10 seconds and plays them back with the tracked position drawn on top. The question on screen is the one that matters: Does the dot stay on the mouse?
- If it does, and the arena outline sits on the floor boundary, continue.
- If the dot jumps to a shadow, a reflection or the wall, go back with ‹ Setup. Fix the calibration or choose another preview window, then tap Update Preview. FAQ & troubleshooting covers the usual causes.
4. Analyze the full video
Tap Analyze Full Video. The whole recording is read at 10 samples per second. A progress bar shows the samples processed and an estimate of the time left.
- Pause & Save stops the analysis and keeps everything done so far. Leaving the app does the same automatically.
- A checkpoint is written about every 30 seconds of work. If the app is closed, the start screen shows Unfinished analysis found → Resume Analysis.
When the analysis finishes, the result is saved and the run folder with the raw tracking files is written to Files › On My iPhone › RodentFlow › Experiments.
5. Read the result
Tap Open Result. You will see:
- the metrics card: total distance, center time and entries, latency to the center, immobility, mobile time;
- the arena plot, switchable between Path and Heatmap;
- time-binned series, such as distance per 5-minute bin;
- Methods, which describes how each number was computed and with which parameters;
- Analysis settings, which lets you change the center zone, moving threshold and so on. The metrics are recomputed instantly from the saved positions, and the video is not tracked again.
6. Score the next animal
Tap Next Animal. Assay, group, phase and day are kept. Choose the next video. If the camera did not move, tap Use Previous Setup on the setup screen to reuse the arena size, calibration and analysis settings. Check that the handles still sit on the corners, then generate the preview as before.
7. Compare groups
When a few animals per group are saved, open the Groups tab, or tap Compare in Groups on a result.
- Assay: Open Field / Center.
- Analysis: design Compare groups, measure Total distance (or any other).
- Groups: order them so that the control comes first. Tap a color dot to change its color.
- Figure: bar, box or mean ± SEM, with every animal shown as a point.
- Statistics: the test that was run and why, descriptive statistics per group, and pairwise comparisons.
Export the figure as PNG, the statistics as JSON, or copy a text summary for your notes.
Try it without a video
The sample tables below are synthetic data made for trying the import and the Groups tab. Download one to the iPhone, then tap Import Table in the New experiment card after choosing the matching assay.
| File | Assay to choose | What it shows |
|---|---|---|
| example_open_field_metrics.csv | Open Field / Center | Three groups → ANOVA and Tukey–Kramer |
| example_open_field_chinese_headers.csv | Open Field / Center | The same data with Chinese column names |
| example_nor_test.csv | Novel Object Recognition | Hand-scored times → discrimination index; one animal is flagged for low exploration |
| example_mwm_acquisition.csv | Morris Water Maze | 4 trials × 5 days → learning curve and mixed ANOVA |
| example_beam_trials.csv | Beam Walking | Trials within days |
| example_sucrose_raw.csv | Sucrose Preference | Raw bottle weights per day → preference computed in the app |
| example_bandit_trials.csv | Two-Armed Bandit | 300 trials per mouse → win-stay, lose-shift and a Q-learning fit |